>> import pkg_resources
>> list(pkg_resources.iter_entry_points('sentry.plugins'))
EntryPoint.parse('sentry_statsd = sentry_statsd.plugin:StasdPlugin'), EntryPoint.parse('hipchat = sentry_hipchat.models:HipchatMessage')]
Friday, July 19, 2013
How Sentry discovers plugins
You can use the pkg_resources library to query against sentry.plugins. Each plugin has an .egg directory that defines an entry_point.txt file.

Sunday, July 14, 2013
SQLite3
On Ubuntu 12.04, I was trying to see whether SQLite supports multi column inserts:
As of SQLite 3.7.11 (Ubuntu has 3.7.9 installed), this syntax is possible: http://sqlite.org/releaselog/3_7_11.html
Older responses on Stack Overflow state that it doesn't, referring to the diagram from the SQLite documentation. But this diagram has already been updated to reflect this new change:
sqlite> CREATE TABLE test_table
   ...> (col1 INTEGER NOT NULL,
   ...> col2 CHAR(25));
sqlite> insert into test_table (col1, col2) values (1, 'ab');
sqlite> insert into test_table (col1, col2) values (1, 'ab'),(2, 'bc');
Error: near ",": syntax error
As of SQLite 3.7.11 (Ubuntu has 3.7.9 installed), this syntax is possible: http://sqlite.org/releaselog/3_7_11.html
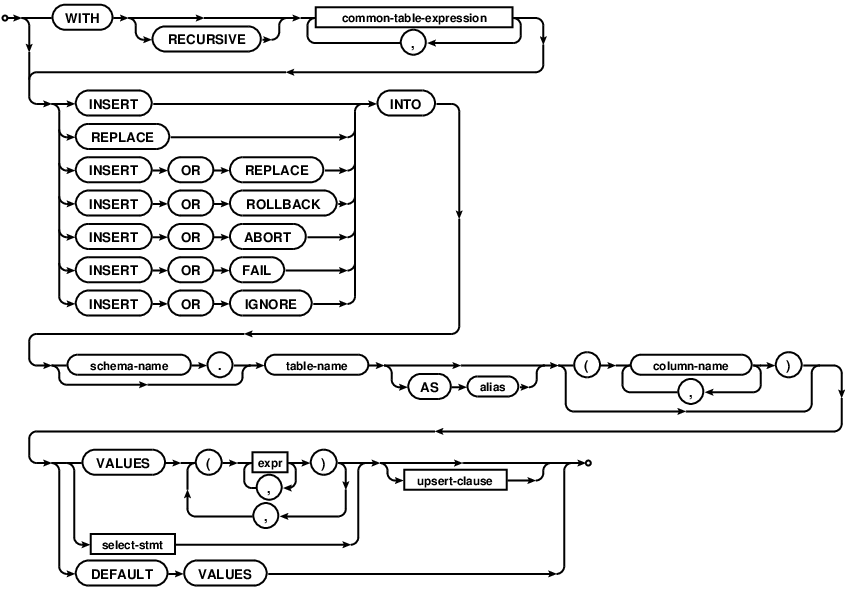
Older responses on Stack Overflow state that it doesn't, referring to the diagram from the SQLite documentation. But this diagram has already been updated to reflect this new change:
Tuesday, June 11, 2013
How are sbrk_base and main_arena related in gdb?
Inside the malloc.c code, there is the use of sbrk_base. How is it related to the main heap (declared as main_arena)?
From the glib v2.15+ code:
malloc/malloc.c
You can gdb to a process and try to verify. You'll need to have the libc6-dev and libc6-dbg packages to get the correct debugging symbols for libc:
Therefore, the sbrk_base does not really applied for other heap arenas (see http://siddhesh.in/journal/2012/10/24/malloc-per-thread-arenas-in-glibc/ for more context)
From the glib v2.15+ code:
malloc/malloc.c
/* A contiguous main_arena is consistent with sbrk_base.  */
  if (av == &main_arena && contiguous(av))
    assert((char*)mp_.sbrk_base + av->system_mem ==
       (char*)av->top + chunksize(av->top));
You can gdb to a process and try to verify. You'll need to have the libc6-dev and libc6-dbg packages to get the correct debugging symbols for libc:
(gdb) print (char *)main_arena->top + (main_arena->top->size & ~(0x4 | 0x2 | 0x1))
$1 = 0xc17000
(gdb) print (char *)mp_.sbrk_base + main_arena->system_mem
$2 = 0xc17000
Therefore, the sbrk_base does not really applied for other heap arenas (see http://siddhesh.in/journal/2012/10/24/malloc-per-thread-arenas-in-glibc/ for more context)
Sunday, June 9, 2013
Exploring how your memory gets used in Python...
A PyCon 2011 talk called "Dude, Where's My Ram?" by David Malcolm presented gdb-heap, a debugging tool that takes advantage of GDB v7's new Python API. The nice part of this tool is that it allows you to inspect your heap core dumps and Python processes without having to add additional instrumentation beforehand.
The code released was originally designed and implemented for Fedora 13 and Fedora 14 back in 2011, but I've managed to figure out how to get it working on Ubuntu v12.04. The GitHub repo is located here: https://github.com/rogerhu/gdb-heap
The code in its current form did not appear to have updates to support glibc v2.15's multiple allocation arenas (see http://stackoverflow.com/questions/10706466/how-does-malloc-work-in-a-multithreaded-environment), so I've started to try to add more support in this GitHub repo. The libheap project is a similar implementation but incorporates multiple arenas, but doesn't carry some of the special logic heuristics and query parser for searching for certain heap sizes.
The code released was originally designed and implemented for Fedora 13 and Fedora 14 back in 2011, but I've managed to figure out how to get it working on Ubuntu v12.04. The GitHub repo is located here: https://github.com/rogerhu/gdb-heap
The code in its current form did not appear to have updates to support glibc v2.15's multiple allocation arenas (see http://stackoverflow.com/questions/10706466/how-does-malloc-work-in-a-multithreaded-environment), so I've started to try to add more support in this GitHub repo. The libheap project is a similar implementation but incorporates multiple arenas, but doesn't carry some of the special logic heuristics and query parser for searching for certain heap sizes.
Thursday, June 6, 2013
Why your Python program can't start when using python-dbg...
Recently, I installed python-dbg and started noticing errors when trying to load C-extension modules such as the PyCrypto library. There are errors such as "undefined symbol" called by Py_InitModule4_64:
From the /usr/share/doc/python2.7-dbg/README.debug file:
We can find this definition declared inside the Python source code under Include/modsupport.h file. Normally under 64-bit platforms,
the Py_InitModule4 is renamed to Py_InitModule4_64 as defined in PEP0353.
Once the python2.7-dbg package is installed, you can use gdb with the Python debugging symbols but it apparently doesn't provide nearly the rich annotated information supplied with the Py_TRACE_REF flag. The problem though is the python-dbg binary however is incompatible with modules not compiled with them as mentioned in /usr/share/doc/python2.7/SpecialBuilds.txt.gz:
The solution seems to be to use gdb with the standard debugging symbols and the default Python binary (which appear to have compiler optimizations that prevent gdb from reading Python frame information), or recompiling all your C-extension modules with the --with-pydebug flag. Ubuntu comes with -dbg packages for many Python libraries, but if you have ones normally installed via pip installs, these may need to be recompiled manually (i.e. via python-dbg setup.py --debug).
>>> import Crypto.Cipher.AES Traceback (most recent call last): File "What's going on? Apparently the python2.7-dbg binary is configured with the --with-pydebug flag, which turns on the Py_DEBUG ifdef directive, which turns on the Py_TRACE_REFS directive:", line 1, in File "/usr/local/lib/python2.7/dist-packages/Crypto/Cipher/AES.py", line 50, in from Crypto.Cipher import _AES ImportError: /usr/local/lib/python2.7/dist-packages/Crypto/Cipher/_AES.so: undefined symbol: Py_InitModule4_64 Error in sys.excepthook: Traceback (most recent call last): File "/usr/lib/python2.7/dist-packages/apport_python_hook.py", line 66, in apport_excepthook from apport.fileutils import likely_packaged, get_recent_crashes File "/usr/lib/python2.7/dist-packages/apport/__init__.py", line 1, in from apport.report import Report File "/usr/lib/python2.7/dist-packages/apport/report.py", line 20, in import apport.fileutils File "/usr/lib/python2.7/dist-packages/apport/fileutils.py", line 22, in from apport.packaging_impl import impl as packaging File "/usr/lib/python2.7/dist-packages/apport/packaging_impl.py", line 20, in import apt File "/usr/lib/python2.7/dist-packages/apt/__init__.py", line 21, in import apt_pkg ImportError: /usr/lib/python2.7/dist-packages/apt_pkg.so: undefined symbol: Py_InitModule4_64 Original exception was: Traceback (most recent call last): File " ", line 1, in File "/usr/local/lib/python2.7/dist-packages/Crypto/Cipher/AES.py", line 50, in from Crypto.Cipher import _AES ImportError: /usr/local/lib/python2.7/dist-packages/Crypto/Cipher/_AES.so: undefined symbol: Py_InitModule4_64
From the /usr/share/doc/python2.7-dbg/README.debug file:
python2.7-dbg contains two sets of packages:

 - debugging symbols for the standard python2.7 build. When this package
   is installed, gdb will automatically load up the debugging symbols
   from it when debugging python2.7 or one of the included extension
   modules.

 - a separate python2.7-dbg binary, configured --with-pydebug, enabling the
   additional debugging code to help debug memory management problems.
.
.
   Py_DEBUG implies LLTRACE, Py_REF_DEBUG,
   Py_TRACE_REFS, and PYMALLOC_DEBUG (if WITH_PYMALLOC is enabled).
   In addition, C assert()s are enabled (via the C way: by not defining
   NDEBUG), and some routines do additional sanity checks inside
   "#ifdef Py_DEBUG" blocks.
We can find this definition declared inside the Python source code under Include/modsupport.h file. Normally under 64-bit platforms,
the Py_InitModule4 is renamed to Py_InitModule4_64 as defined in PEP0353.
#ifdef Py_TRACE_REFS
 /* When we are tracing reference counts, rename Py_InitModule4 so
    modules compiled with incompatible settings will generate a
    link-time error. */
 #if SIZEOF_SIZE_T != SIZEOF_INT
 #undef Py_InitModule4
 #define Py_InitModule4 Py_InitModule4TraceRefs_64
 #else
 #define Py_InitModule4 Py_InitModule4TraceRefs
 #endif
#endif
Once the python2.7-dbg package is installed, you can use gdb with the Python debugging symbols but it apparently doesn't provide nearly the rich annotated information supplied with the Py_TRACE_REF flag. The problem though is the python-dbg binary however is incompatible with modules not compiled with them as mentioned in /usr/share/doc/python2.7/SpecialBuilds.txt.gz:
Py_TRACE_REFS
-------------

Turn on heavy reference debugging.  This is major surgery.  Every PyObject grows
two more pointers, to maintain a doubly-linked list of all live heap-allocated
objects.  Most built-in type objects are not in this list, as they're statically
allocated.  Starting in Python 2.3, if COUNT_ALLOCS (see below) is also defined,
a static type object T does appear in this list if at least one object of type T
has been created.

Note that because the fundamental PyObject layout changes, Python modules
compiled with Py_TRACE_REFS are incompatible with modules compiled without it.

Py_TRACE_REFS implies Py_REF_DEBUG.
The solution seems to be to use gdb with the standard debugging symbols and the default Python binary (which appear to have compiler optimizations that prevent gdb from reading Python frame information), or recompiling all your C-extension modules with the --with-pydebug flag. Ubuntu comes with -dbg packages for many Python libraries, but if you have ones normally installed via pip installs, these may need to be recompiled manually (i.e. via python-dbg setup.py --debug).
Wednesday, June 5, 2013
PyLint E1121 errors
If you've upgraded to Pylint v0.28.0 recently, you may have found that Pylint is starting to report this issue:
E1121: 3,0: Too many positional arguments for function call
Strangely enough, the code below does not report this issue.
Because the hashlib library is implemented as a C-level module (see http://www.logilab.org/78354 for more context), Pylint needs to have these string declarations in place to do proper static code analysis. It turns out that recent changes to Pylint added the digest() method to the hashlib module but forgot to include the self parameter.
Within the Pylint type checker (in /usr/local/lib/python2.7/dist-packages/pylint/checkers/typecheck.py, line 268), the function is inferred to require an additional 'self' argument. However, because the string declaration does not, this error message gets reported.
import hashlib
hmm = hashlib.sha1('tst')
hmm.digest()
E1121: 3,0: Too many positional arguments for function call
Strangely enough, the code below does not report this issue.
import hashlib
hmm = hashlib.sha1('tst')
hmm.hexdigest()
Because the hashlib library is implemented as a C-level module (see http://www.logilab.org/78354 for more context), Pylint needs to have these string declarations in place to do proper static code analysis. It turns out that recent changes to Pylint added the digest() method to the hashlib module but forgot to include the self parameter.
Within the Pylint type checker (in /usr/local/lib/python2.7/dist-packages/pylint/checkers/typecheck.py, line 268), the function is inferred to require an additional 'self' argument. However, because the string declaration does not, this error message gets reported.
if isinstance(called, astng.BoundMethod):
    # Bound methods have an extra implicit 'self' argument.
    num_positional_args += 1
The proper fix is included at this link: https://bitbucket.org/rogerjhu/astng/commits/fd99960bc86a26503cb0fc2eb5f7f484c4861ccdSaturday, June 1, 2013
Debugging Python programs in GDB
The instructions at http://wiki.python.org/moin/DebuggingWithGdb make it seem complicated, but it turns out to be very simple in Ubuntu 12.04 to use the GDB to debug Python code. The downside is that you have to run the Python program themselves with an interpreter compiled with the symbols in order to take advantage of this functionality.
If you're using Ubuntu 12.04, you can use the following apt-get install:
Suppose we had a Python program called debug_me.py:
python-dbg debug_me.py &
To attach to the process, you would do:
gdb python-dbg [Python PID]
The commands that you could use are (help py-)
You can also use standard GDB commands but any C extensions must also be compiled with the debugging symbols too! For more info, check out the file installed in /usr/share/doc/python2.7-dbg/README.debug (or alternativly at https://wiki.ubuntu.com/PyDbgBuilds)
If you're using Ubuntu 12.04, you can use the following apt-get install:
sudo apt-get install python-dbg
Suppose we had a Python program called debug_me.py:
python-dbg debug_me.py &
To attach to the process, you would do:
gdb python-dbg [Python PID]
The commands that you could use are (help py-)
(gdb) py-list
   2
   3
   4    def debug_me():
   5        for i in xrange(10000):
   6            print i
  >7            time.sleep(5)
   8
   9
  10    debug_me()
(gdb) py-up
#8 Frame 0x2195810, for file /tmp/debug_me.py, line 9, in <module> ()
    debug_me()
</module>
(gdb) py-print i
local 'i' = 0
(gdb) py-bt
#5 Frame 0x2852f20, for file /tmp/debug_me.py, line 7, in debug_me (i=2)
    time.sleep(5)
(gdb) py-print i
local 'i' = 2
(gdb) py-locals
i = 2
You can also use standard GDB commands but any C extensions must also be compiled with the debugging symbols too! For more info, check out the file installed in /usr/share/doc/python2.7-dbg/README.debug (or alternativly at https://wiki.ubuntu.com/PyDbgBuilds)
Subscribe to:
Posts (Atom)